By Arpan Ghosh on Jul 8, 2024.
Reading time: 2 minutes.
Collection of a few projects that I am proud of!

High Throughput Data Analysis
This is the analysis of the data obtained from high throughput screening assay of zebrafish CYP2Y3 enzyme for my masters thesis project. There were 1920 compounds from Toxcast Phase II library and 3 different endpoints for this assay. This analysis includes kinetic analysis across replicates, data comparison with positive and negative controls, and identification of most suitable substrates. The project code is available here.

Fitbit Health Data analysis
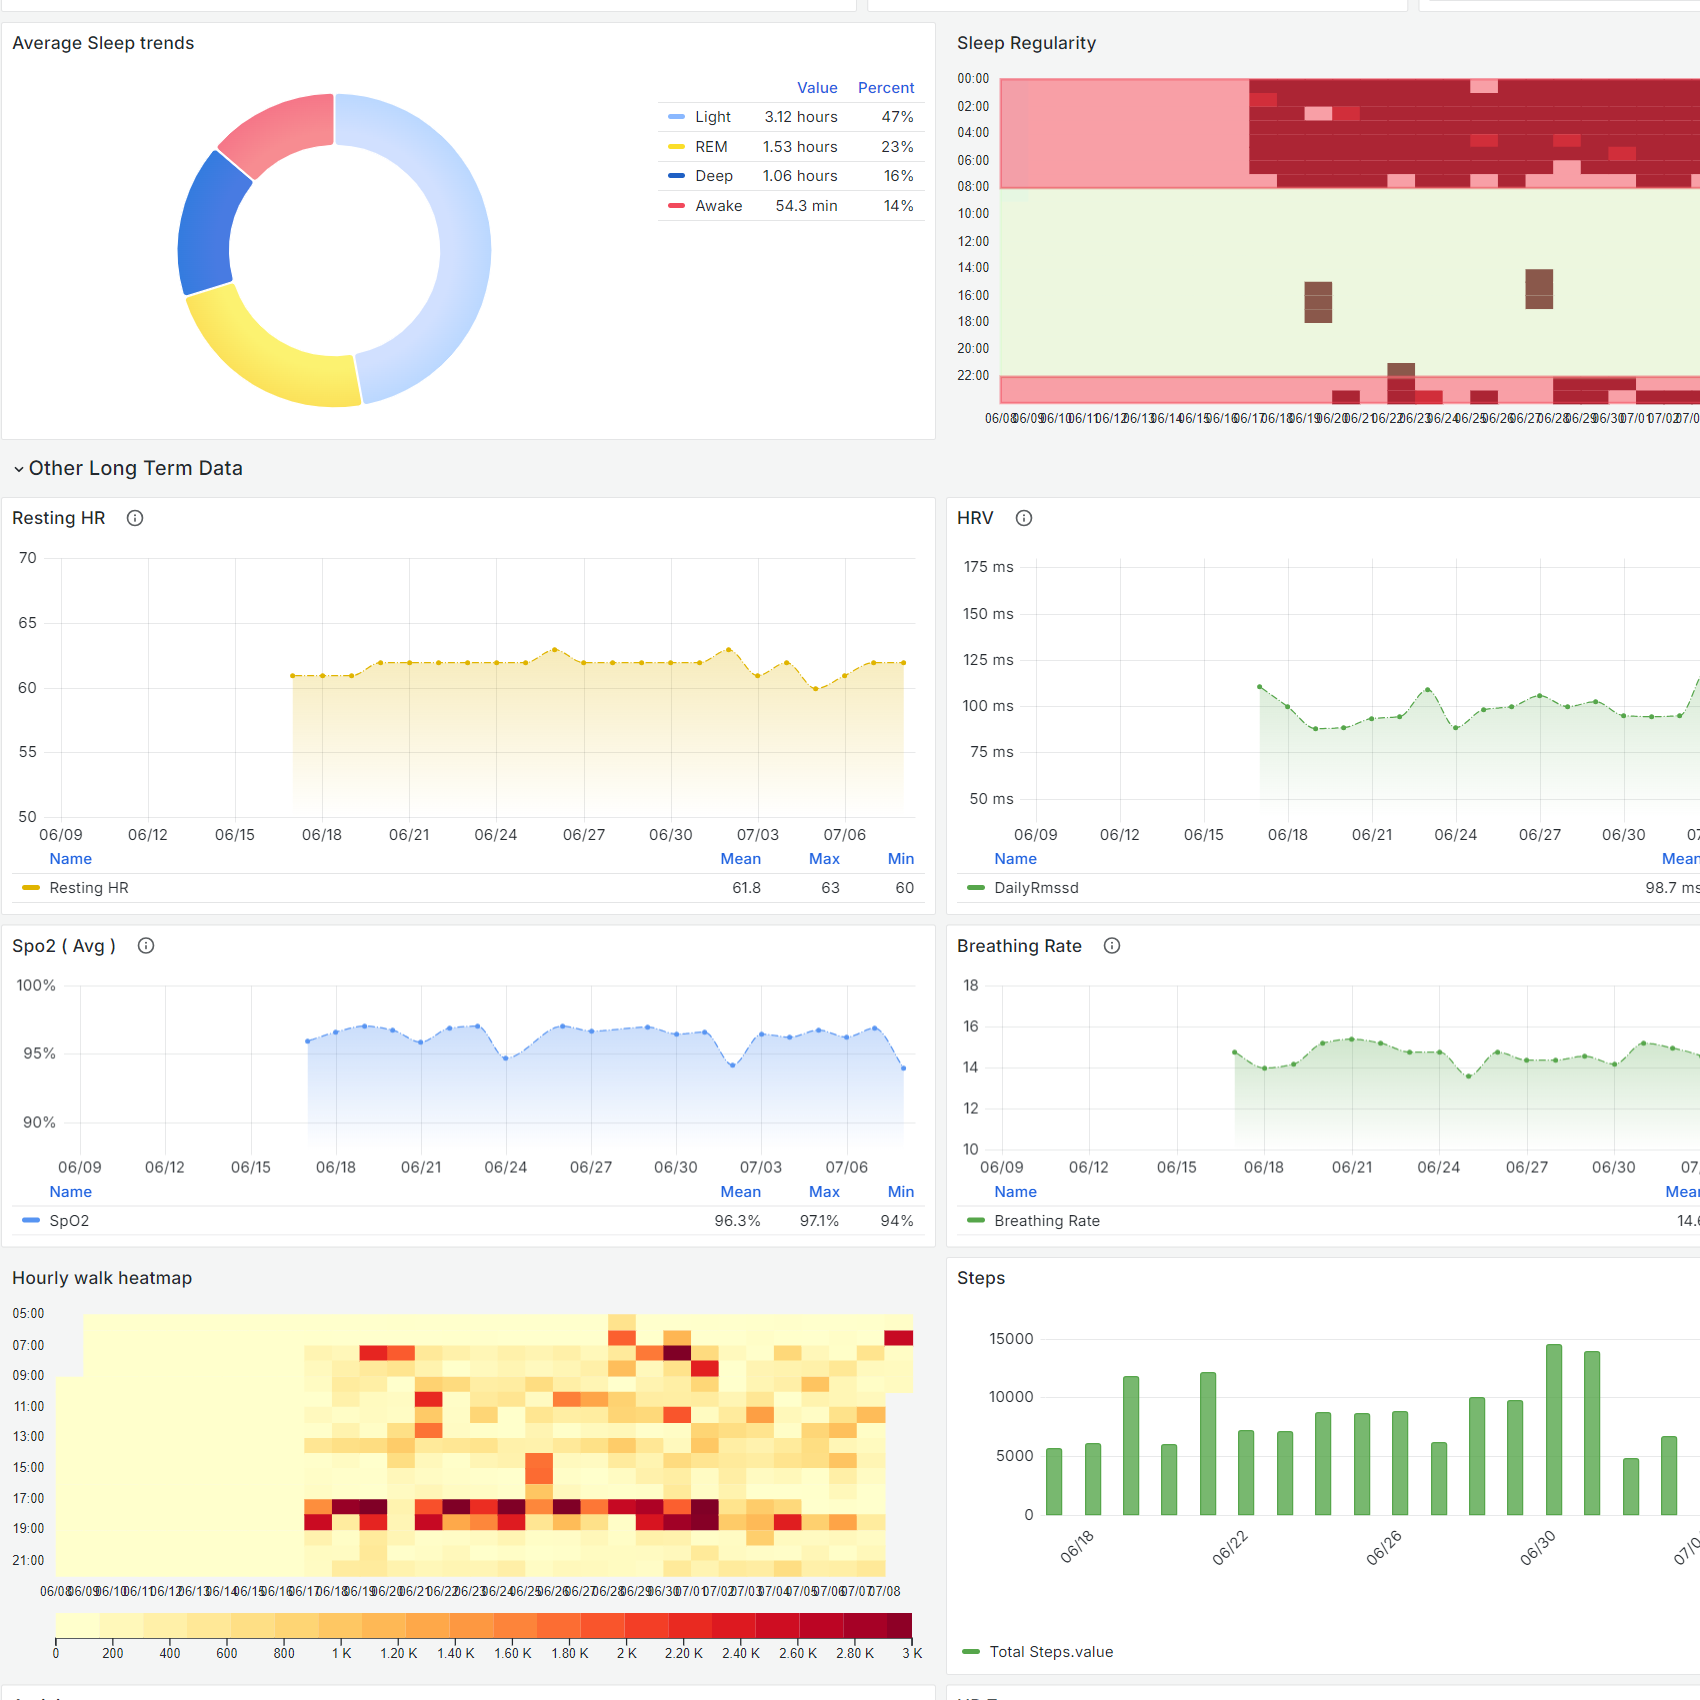
This project is available on my github with 200+ stars and 25+ forks. This project uses the Fitbit API to fetch all the data endpoints and populates them in a local influxdb database, which is furthur used to plot interactable figures with Grafana. The process includes timezone conversion with pytz, dataframe construction and cleaning up with Pandas, optimizing API calls to avoid rate limiting, appropriate delay injection and error handling.

Fitbit Welness Report
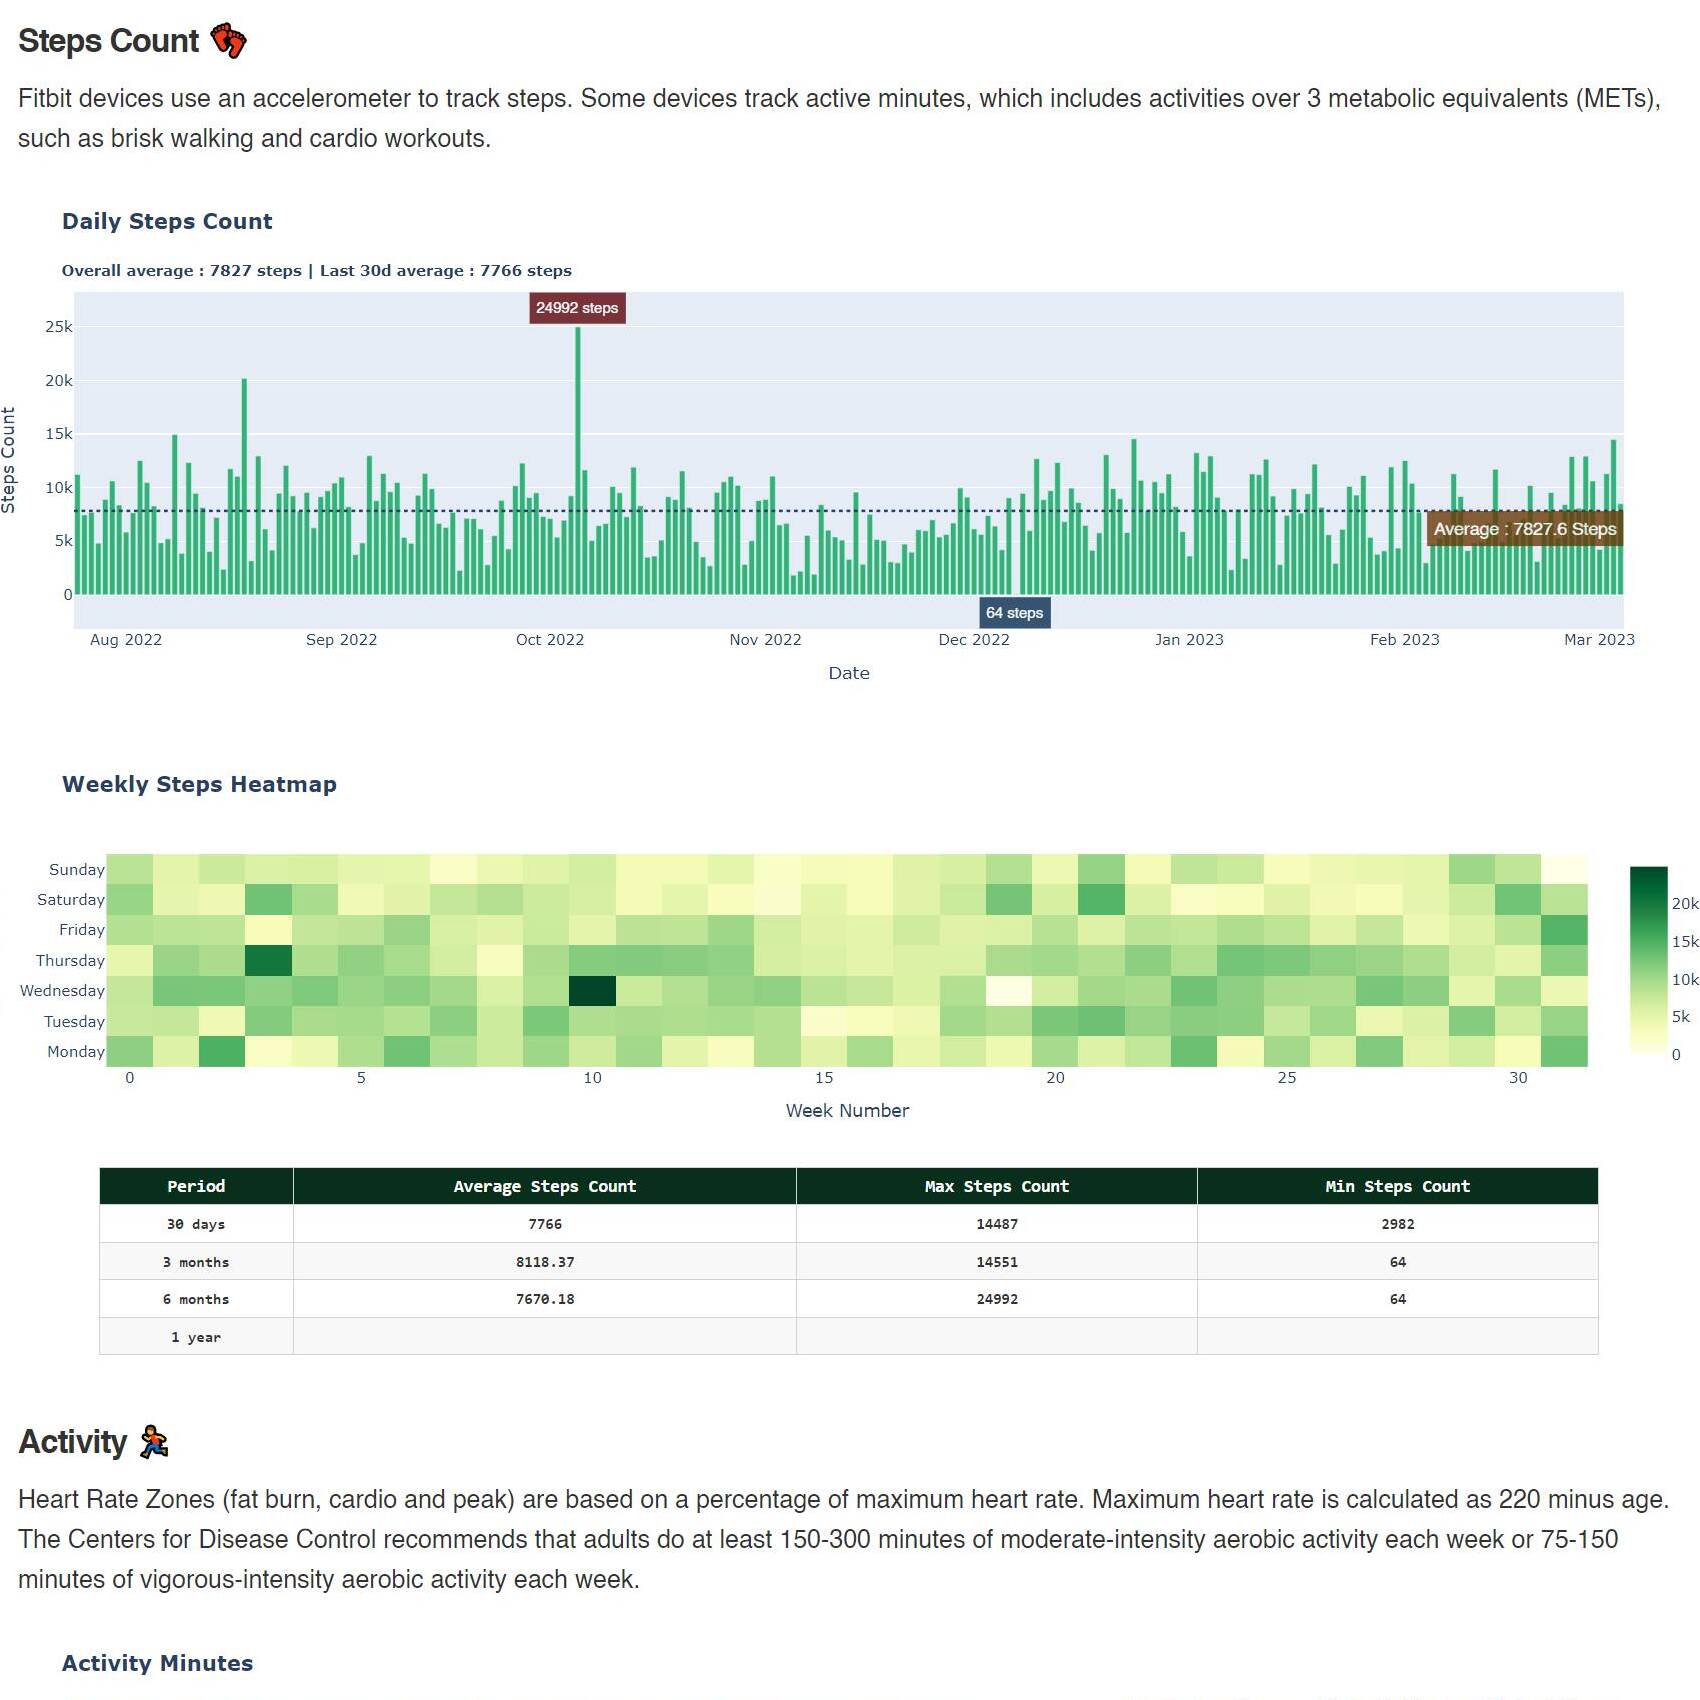
This project is a python flask app which can be used to generate a one-time report of yearly health data in summary format. This web app is available on external as well as self-hosted hosting instances. This script uses plotly to plot interactive web plots and backend is provided by pandas dataframe. It calculates and displays Min, Max and Avg. of every measurement. You can visualize your sleep timing trend over time and weekly steps heatmap!

Weather Data Dashboard
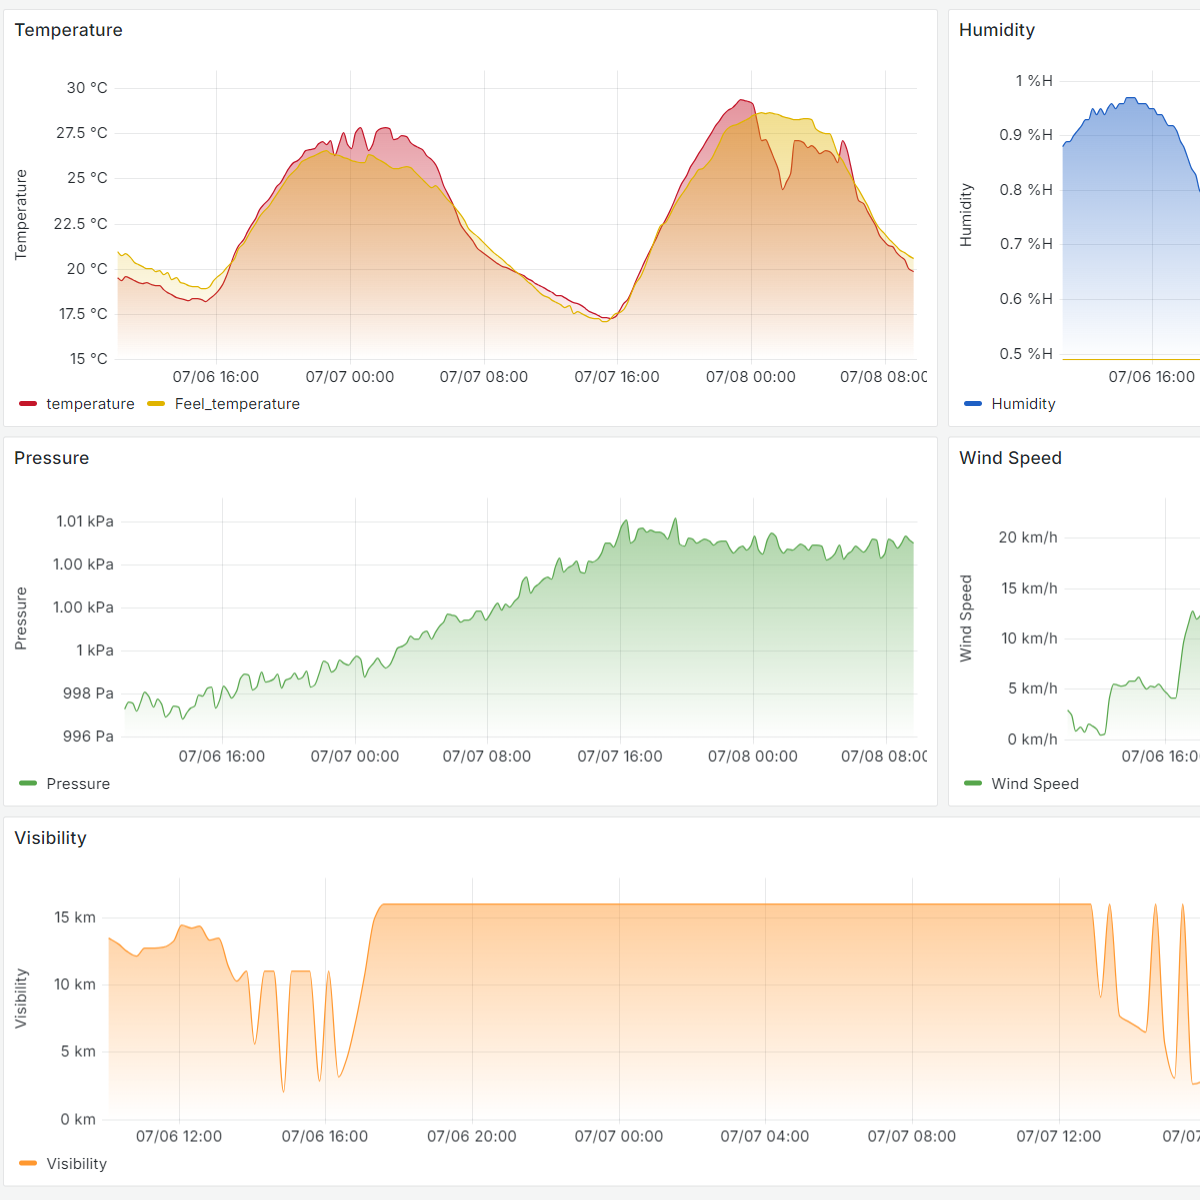
This project uses piweather API to fectch weather data and stores them in a local influxdb database. The data includes temperature, humidity, pressure, wind speed and visibility. Furthurmore, A Docker container was constructed with all the dependencies where you can easily customize fetch frequency, location, units etc. for standalone deployment.

Kindle Reading Data Analysis
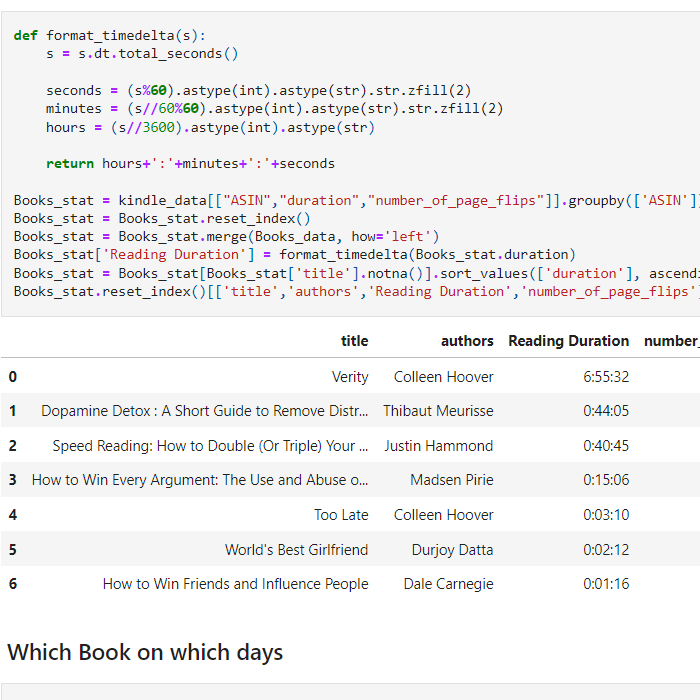
This project imports data from Amazon’s kindle data export and produces insights on reading habits. You can visualize per day reading duration and time spent on a particular book. Time is calculated across all sessions in a day and summarized in daywise or bookwise tables.

Batch image watermarking
This project uses python’s image processing library PIL to produce a watermarked version of the image. The watermark text is customizable and the size auto adjusts and blends with image based on image size and given opacity. This can be used in batch mode to watermark all images in a given directory.